
Inventory AI for Restaurants

Count more, earn more, waste less
Adoption that sticks
Data you can use today
Turn labor into guest value
Reallocate staff to hospitality, upselling, and speed of service.

34% Less Waste

50% Fewer Stockouts

$1,200/month/location Saved

800%+ ROI
How it Works
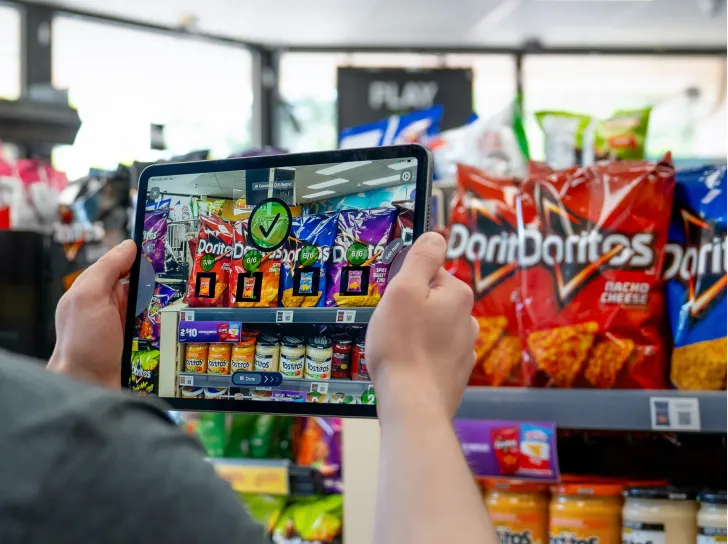
Open the App
Scan Your Entire Inventory
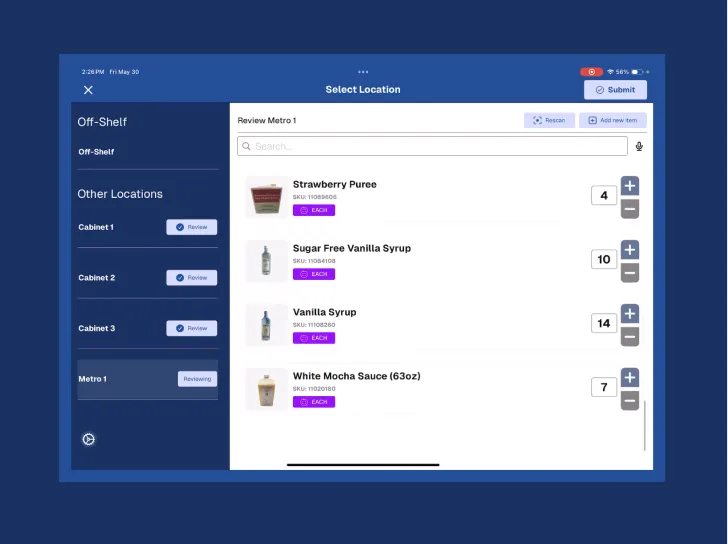
Sync & Act

Metro Shelves
Scan bays and rows in seconds with on‑device Spatial Vision.
Get per‑row counts that feed ordering. No fixed cameras or barcodes.

Coolers, Freezers & Walk-Ins
Count reliably in cold storage without wifi, wiring, or fixed hardware.
Use a phone or tablet to capture accurate on‑hand and spot lows fast.

Make-Lines
Keep prep aligned to demand with live, accurate makeline counts.
Prevent over‑prepping, protect freshness, and lift margins.

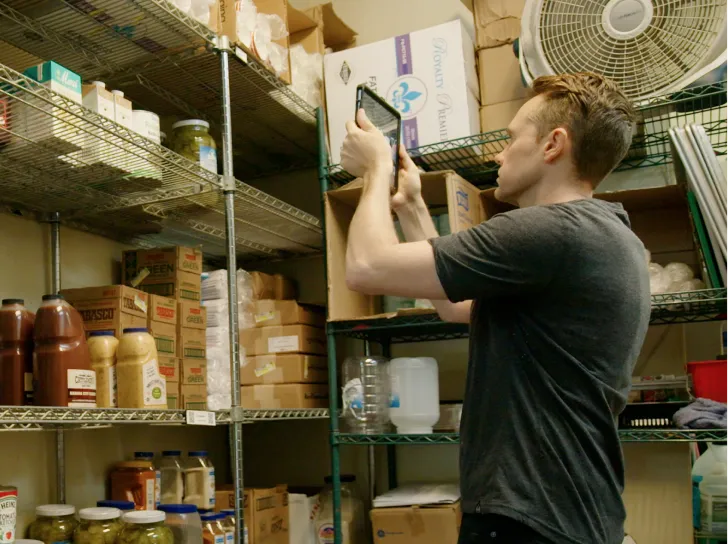
Back of House
Adapt to busy storerooms and mixed layouts with AR‑guided scans.
Finish counts in minutes and submit timely, accurate orders.

Delivery Pallets & Order Accuracy
Validate receipts at the dock in real time to catch errors early.
Confirm quantities, flag misses, and reconcile before stock hits the floor.
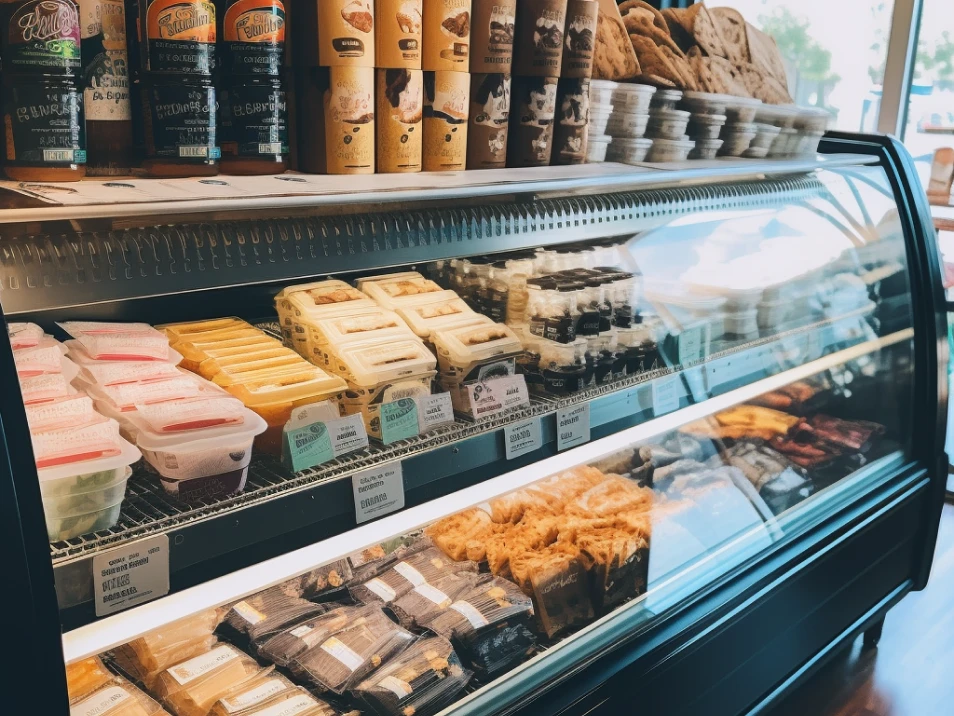
Front of House
Keep displays, cubbies, and grab‑and‑go stocked with live, per‑row counts on a phone or tablet.
Replenish before guests notice, keep lines moving, and lift sales
